Module 5: Decadal Growth, 2001-2011
Concept
Subtopic 5.1: State-level Decadal Growth
- In ten years the population rose by 2,11,00,943, giving a decadal growth rate of 25.4% in 2001-2011.
- Compared with 28.6% in 1991-2001, the decadal growth clearly declined in 2001-2011.
- Bihar's growth is above the all-India rate of 17.7% — higher by 7.7 percentage points.
- Correct answer 25.4% (final census). The source book printed option (c) as 21.54% with key (c); 19.76, 21.33 and 24.06 are the growth rates of 1951-61, 1961-71 and 1971-81.
- Answer (d) 25.4%. (25.07% was the provisional figure.)
- 10,40,99,452 − 8,29,98,509 = 2,11,00,943.
- 28.6%, so 2001-11 shows a decline.
- 25.4 − 17.7 = 7.7.
- Question: Population growth rate of Bihar in the 2001-11 decade is: [BPSC PYQ] Answer: 25.4%.
- Question: What is Bihar's decadal population growth rate? [Objective set] Answer: 25.4%.
- Question: By how many persons did Bihar's population increase during 2001-2011? Answer: 2,11,00,943.
- Question: Decadal growth rate of Bihar in 1991-2001 was: Answer: 28.6%.
- Question: By how many percentage points was Bihar's 2001-11 growth higher than India's? Answer: 7.7.
MCQs
Answer this question, then use Next.
Question 1: Population growth rate of Bihar in the 2001-11 decade is: [BPSC PYQ]
Question 2: What is Bihar's decadal population growth rate? [Objective set]
Question 3: By how many persons did Bihar's population increase during 2001-2011?
Question 4: Decadal growth rate of Bihar in 1991-2001 was:
Question 5: By how many percentage points was Bihar's 2001-11 growth higher than India's?
One-liners
Write your answer, then submit to see the correct answer.
Population growth rate of Bihar in the 2001-11 decade is: [BPSC PYQ]
25.4%.What is Bihar's decadal population growth rate? [Objective set]
25.4%.By how many persons did Bihar's population increase during 2001-2011?
2,11,00,943.Decadal growth rate of Bihar in 1991-2001 was:
28.6%.By how many percentage points was Bihar's 2001-11 growth higher than India's?
7.7.Concept
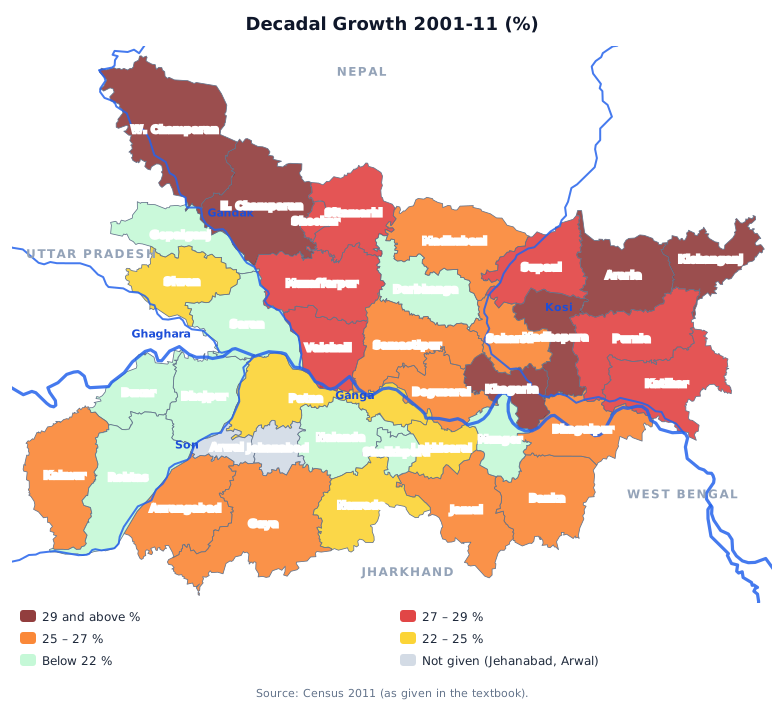
Subtopic 5.2: District-wise Decadal Growth
- Highest growth: Madhepura 31.12%, then Kishanganj 30.40%, Araria 30.25%, Khagaria 30.19% and East Champaran 29.43%.
- Lowest growth: Gopalganj 19.02%, then Darbhanga 19.47%, Munger 20.21% and Rohtas 20.78%.
- Patna's growth was 23.73% (25th). Figures for Jehanabad and Arwal are not given (Arwal was carved out of Jehanabad in 2001).
| Rank | District | Decadal growth % |
|---|---|---|
| 1 | Madhepura | 31.12 |
| 2 | Kishanganj | 30.40 |
| 3 | Araria | 30.25 |
| 4 | Khagaria | 30.19 |
| 5 | East Champaran | 29.43 |
| 6 | West Champaran | 29.29 |
| 7 | Supaul | 28.66 |
| 8 | Vaishali | 28.57 |
| 9 | Katihar | 28.35 |
| 10 | Purnia | 28.33 |
| 11 | Muzaffarpur | 28.14 |
| 12 | Sitamarhi | 27.62 |
| 13 | Sheohar | 27.19 |
| 14 | Banka | 26.48 |
| 15 | Begusarai | 26.44 |
| 16 | Gaya | 26.43 |
| 17 | Aurangabad | 26.18 |
| 18 | Kaimur | 26.17 |
| 19 | Saharsa | 26.02 |
| 20 | Jamui | 25.85 |
| 21 | Samastipur | 25.53 |
| 22 | Madhubani | 25.51 |
| 23 | Bhagalpur | 25.36 |
| 24 | Lakhisarai | 24.77 |
| 25 | Patna | 23.73 |
| 26 | Siwan | 22.70 |
| 27 | Nawada | 22.63 |
| 28 | Buxar | 21.67 |
| 29 | Saran | 21.64 |
| 30 | Bhojpur | 21.63 |
| 31 | Nalanda | 21.39 |
| 32 | Sheikhpura | 21.09 |
| 33 | Rohtas | 20.78 |
| 34 | Munger | 20.21 |
| 35 | Darbhanga | 19.47 |
| 36 | Gopalganj | 19.02 |
| 37 | Jehanabad | — |
| 38 | Arwal | — |
- Answer (a) Madhepura (31.12%).
- Answer (b). (The source prints Araria's rate as 3.25, a misprint for 30.25.)
- Gopalganj 19.02%.
- Kishanganj 30.40%.
- Patna 23.73% (below the state's 25.4%).
- Jehanabad and Arwal (Arwal was formed from Jehanabad).
- Darbhanga 19.47%.
- East Champaran 29.43%; the others exceeded 30%.
- Question: Which district has the highest population growth rate? [Objective set] Answer: Madhepura.
- Question: Match growth rates: A. Kishanganj B. Araria C. Khagaria D. East Champaran with 1. 30.40 2. 30.25 3. 30.19 4. 29.43 [Objective set] Answer: A-1, B-2, C-3, D-4.
- Question: Which district recorded the lowest decadal growth in 2001-11? Answer: Gopalganj.
- Question: Second highest decadal growth (2001-11) was in: Answer: Kishanganj.
- Question: Patna district's decadal growth rate (2001-11) was: Answer: 23.73%.
- Question: Which two districts have no growth figure in the table? Answer: Jehanabad and Arwal.
- Question: Which district had the second lowest growth (19.47%)? Answer: Darbhanga.
- Question: All of these districts grew by more than 30% EXCEPT: Answer: East Champaran.
MCQs
Answer this question, then use Next.
Question 1: Which district has the highest population growth rate? [Objective set]
Question 2: Match growth rates: A. Kishanganj B. Araria C. Khagaria D. East Champaran with 1. 30.40 2. 30.25 3. 30.19 4. 29.43 [Objective set]
Question 3: Which district recorded the lowest decadal growth in 2001-11?
Question 4: Second highest decadal growth (2001-11) was in:
Question 5: Patna district's decadal growth rate (2001-11) was:
Question 6: Which two districts have no growth figure in the table?
Question 7: Which district had the second lowest growth (19.47%)?
Question 8: All of these districts grew by more than 30% EXCEPT:
One-liners
Write your answer, then submit to see the correct answer.
Which district has the highest population growth rate? [Objective set]
Madhepura.Match growth rates: A. Kishanganj B. Araria C. Khagaria D. East Champaran with 1. 30.40 2. 30.25 3. 30.19 4. 29.43 [Objective set]
A-1, B-2, C-3, D-4.Which district recorded the lowest decadal growth in 2001-11?
Gopalganj.Second highest decadal growth (2001-11) was in:
Kishanganj.Patna district's decadal growth rate (2001-11) was:
23.73%.Which two districts have no growth figure in the table?
Jehanabad and Arwal.Which district had the second lowest growth (19.47%)?
Darbhanga.All of these districts grew by more than 30% EXCEPT:
East Champaran.