Mod 2: 5.1.1 Demography of Bihar
The Four Core Pillars (Bihar vs. India at a Glance)
* Massive Population Share: Bihar housed 104.1 million people in 2011, making up 8.6% of India's entire population (1210.6 million) living on less than 3% of the nation's total land area.- Extreme Population Density: With 1,106 persons per sq. km, Bihar's land pressure is nearly three times the national average (382 persons per sq. km).
- Low Urbanization: Only 11.3% of Bihar lived in urban areas in 2011 compared to 31.2% nationally, meaning roughly 89 out of every 100 people lived in villages.
- High Decadal Growth: Between 2001 and 2011, Bihar's population grew by 25.1%, significantly outpacing India's growth rate of 17.6%.
Visual Comparisons
* Population Density (Persons per sq. km):* Bihar (1,106): [████████████████████████████████████████] 1,106
* India (382): [██████████████] 382
- Urbanization Rate (%):
* India (31.2%): [██████████████] 31.2%
- Decadal Growth Rate 2001-2011 (%):
* India (17.6%): [████████] 17.6%
Comprehensive Indicator Breakdown (Table 5.1.1 Categorized)
| Category | Indicator | Bihar (2001) | Bihar (2011) | Trend in Bihar | India (2011) |
|---|---|---|---|---|---|
| Size & Density | Population (million) | 82.9 | 104.1 | Grew by 21.2 million | 1210.6 |
| Density (persons/sq. km) | 880 | 1106 | +226 persons/sq. km | 382 | |
| Growth & Settlement | Decadal Growth (%) | 28.6% | 25.1% | Slowed down (-3.5%) | 17.6% |
| Urbanization (%) | 10.5% | 11.3% | Barely grew (+0.8%) | 31.2% | |
| Gender Balance | Overall Sex Ratio | 919 | 918 | Marginally declined (-1) | 943 |
| Child Sex Ratio (0-6) | 942 | 935 | Declined (-7) | 919 | |
| Administrative Units | Districts | 37 | 38 | +1 (Arwal created) | 640 |
| CD Blocks | 533 | 534 | +1 | 5924 | |
| Towns | 130 | 199 | +69 statutory/census towns | 7935 | |
| Villages | 45098 | 39073 | Reclassified / consolidated | 597369 |
Cause-and-Effect Flow: Economic Impact
* High Decadal Growth (25.1%) + Small Land Area ➔ Highest Population Density (1,106 persons/sq. km)- Highest Population Density ➔ Severe Fragmentation of Landholdings (Sub-divided family plots)
- Low Urbanization (11.3% vs India's 31.2%) ➔ Excess Labor Remains Trapped in Agriculture (Disguised Unemployment)
- Rural Disguised Unemployment ➔ Heavy Demand on State Resources (Schools, Healthcare, Subsidies)
High-Yield Facts for Exam Revision
* Population Rank: 3rd most populous state in India (behind Uttar Pradesh and Maharashtra) as of Census 2011.- Density Rank: Ranked #1 among all Indian states in population density (1,106/sq. km), ahead of West Bengal (1,028/sq. km).
- Child vs. Adult Sex Ratio: While Bihar's overall sex ratio (918) was lower than India's average (943), its Child Sex Ratio (935) remained higher than the national child average (919).
- Administrative Change: Bihar had 37 districts in 2001 and reached 38 districts by 2011 with the creation of Arwal district from Jehanabad.
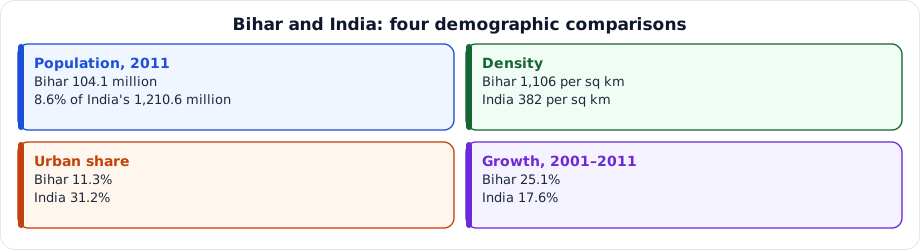
Figure: Bihar and India: four demographic comparisons
- Density Rank: Ranked #1 among all Indian states in population density (1,106/sq. km), ahead of West Bengal (1,028/sq. km).
- Child vs. Adult Sex Ratio: While Bihar's overall sex ratio (918) was lower than India's average (943), its Child Sex Ratio (935) remained higher than the national child average (919).
- Administrative Change: Bihar had 37 districts in 2001 and reached 38 districts by 2011 with the creation of Arwal district from Jehanabad.
Figure: Bihar and India: four demographic comparisons
Answer this question, then use Next.
Question 1: What influences the macro-economic scenario of a region?
Question 2: According to Census 2011, what is the population of Bihar?
Question 3: According to Census 2011, what was India's total population?
Question 4: What percentage of India's total population resides in Bihar (Census 2011)?
Question 5: What was the Decadal Growth Rate of Bihar during 2001-11?
Question 6: What was the Decadal Growth Rate of India during 2001-11?
Question 7: What is the level of urbanization in Bihar?
Question 8: What is the national average for urbanization?
Question 9: What is the population density in Bihar?
Question 10: What is the population density of India?
One-liners
Write your answer, then submit to see the correct answer.
Density Rank: Ranked #1 among all Indian states in population density (1,106/sq. km), ahead of West Bengal (1,028/sq. km).
Ranked #1 among all Indian states in population density (1,106/sq. km), ahead of West Bengal (1,028/sq. km).Child vs. Adult Sex Ratio: While Bihar's overall sex ratio (918) was lower than India's average (943), its Child Sex Ratio (935) remained higher than the national child average (919).
While Bihar's overall sex ratio (918) was lower than India's average (943), its Child Sex Ratio (935) remained higher than the national child average (919).Administrative Change: Bihar had 37 districts in 2001 and reached 38 districts by 2011 with the creation of Arwal district from Jehanabad.Figure: Bihar and India: four demographic comparisons
Bihar had 37 districts in 2001 and reached 38 districts by 2011 with the creation of Arwal district from Jehanabad.Figure: Bihar and India: four demographic comparisons