Module 4: Generation Capacity & Energy Mix (Table 5.5.1 & Chart 5.5.1)
Electricity generation in Bihar is derived from coal-based thermal plants, hydroelectric units, and renewable energy installations. Total installed power generation capacity expanded from 4,767 MW in March 2019 to 6,073 MW in March 2020 (a growth of 27.4 percent).
Sectoral Growth Rates (March 2019 to March 2020):
- Coal-based thermal power grew by 21.7 percent.
- Hydropower grew by 50.6 percent.
- Renewable energy sources recorded the highest growth of 58.0 percent.
Ownership Share in Power Capacity (March 2020):
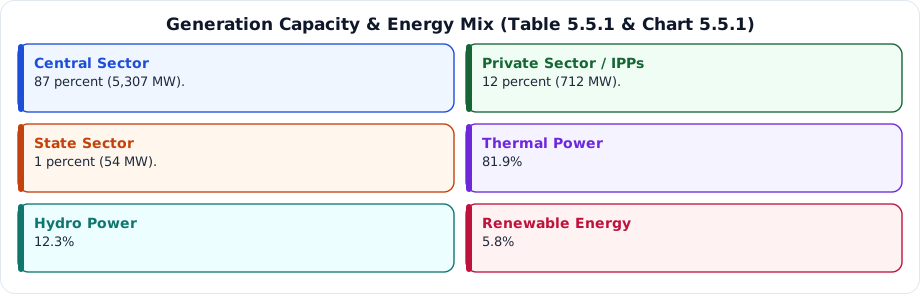
- Central Sector: 87 percent (5,307 MW).
- Private Sector / IPPs: 12 percent (712 MW).
- State Sector: 1 percent (54 MW).
Table 5.5.1: Existing Generation Capacity in Bihar (March 2020 in MW)
| Owner / Sector | Thermal (Coal) | Nuclear | Hydro (Renewable) | RES (MNRE) | Grand Total |
|---|---|---|---|---|---|
| State | 0 | 0 | 54 | 0 | 54 MW |
| Private / IPPs | 488 | 0 | 0 | 224 | 712 MW |
| Central | 4268 | 0 | 729 | 310 | 5307 MW |
| Total | 4756 MW | 0 MW | 783 MW | 534 MW | 6073 MW |
Chart 5.5.1: Contribution of Different Sources of Energy:
- Thermal Power: 81.9%
- Hydro Power: 12.3%
- Renewable Energy: 5.8%
- Coal-based thermal power grew by 21.7 percent.
- Hydropower grew by 50.6 percent.
- Renewable energy sources recorded the highest growth of 58.0 percent.
- Coal-based thermal power grew by ______ percent. — 21.7
- Hydropower grew by ______ percent. — 50.6
- Renewable energy sources recorded the highest growth of ______ percent. — 58.0
Answer this question, then use Next.
According to Chart 5.5.1, what was the percentage share of thermal power in the total energy mix of Bihar in March 2020?
One-liners
Write your answer, then submit to see the correct answer.
Coal-based thermal power grew by ______ percent.
21.7Hydropower grew by ______ percent.
50.6Renewable energy sources recorded the highest growth of ______ percent.
58.0